There are many initiatives to help with the fight against COVID-19 and the consequences it has on the world. Xomnia has taken up a Kaggle challenge to help answer scientific questions related to the pandemic for the medical community. Kaggle competitions provide an opportunity to make an impact with data and artificial intelligence. With this challenge, a team of Xomnia data engineers and a data scientist is working to do exactly that.
The team is working on three projects. The first is the Kaggle challenge on the global forecasting of the number of cases and fatalities. The second project is about combining data from various sources into a single location, enabling other data scientists to easily use the data. It will also give us some insight into the consequences of the epidemic. This blog post is about the third project, the CORD-19 Kaggle challenge to help researchers gain insight into the body of research that is related to COVID-19.
Connecting the CORD-19 data
The dataset for this challenge contains metadata of more than 50.000 papers. The majority of the papers also has one or two json files with more metadata and the full text. Many people are working on Natural Language Processing, for example, to create an advanced search engine or to relate papers based on their topics. We decided to focus on the way papers are connected by the references between them.
Only one of our junior data engineers works on this project, but that doesn’t mean he works alone. The whole team has a daily standup to discuss how the past day went, what the plans for today are, and if they can help each other. They also have a weekly review, showcasing what has been accomplished and what the broader plans are. Finally, there are technical sessions to talk about the approaches in-depth and share knowledge.
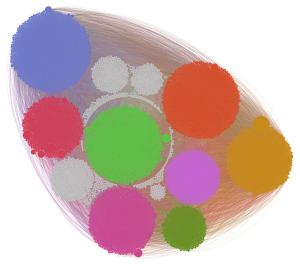
The main goal of the project is a pipeline to extract the network of papers and references from the dataset. This involves connecting the different files in the dataset and finding the best available data for each paper. The references are already in the dataset, so they only need to be matched with the right papers. The extracted data consists of a set of papers and a set of the connections between them. The full network is quite large, which makes visualisation hard. One way to deal with that is filtering the data. In this case, we can exclude papers that are rarely cited.
The output of the pipeline is ready to be imported in graph tools such as Neo4j and Gephi. To make the data easier to use, a kick-start for both tools is provided. An easy way to use the data is through the interactive online visualisation, which was created using Gephi. It can be used to find the most important papers and step through the network, or to find a specific paper. You can access the visualisation here.
What we’ve learned in this Kaggle challenge
Besides the technical result of the project, there have also been some general takeaways. Even a short project can teach you important lessons and reinforce lessons learned in the past. Here are some of the insights we’ve gained:
Start documenting from the beginning. You’re thinking about goals, ideas and designs, so you might as well write them down. If you start later, it costs more time and effort, while certain details are lost and mistakes are easier to make. Early documentation can also help with the thinking process and getting a good mental overview.
A Minimum Viable Product can be very powerful. Delivering a simple prototype and adding just the most important functionality can result in a high impact in relatively little time. It also provides flexibility to deliver versions of the product or to decide that the project is finished. Related to an MVP, it works well to prioritize tasks with high returns, judging them based on the value they provide and the effort they require.
Large graph data doesn’t always need a graph database. Graph data is still relational data, and depending on the queries you want to execute, a relational database also works well. On the other hand, if you have a relational database, you can still use graph (database) software to easily visualize a graph, even if you have little knowledge of graph databases.
Good code is valuable, but refactoring comes with a cost. Planning ahead and writing good code from the start is always better than improving afterwards. However, you can’t plan everything, so try to accommodate future refactoring, for example by making loosely coupled components.
Don’t be an island, even when working on your own. Planned moments of contact, like standups and reviews, are helpful. Don’t forget to also talk in different settings, so you’re more free to go in-depth or off-topic. Keep in touch!