
Data scientists might sometimes face the challenge of an insufficient amount of historical and/or labeled data. As a result, the majority of knowledge discovery methods can’t be used effectively. Without being able to produce extra information for business inquiries, we tend to move on from a project. However, I’d like to challenge this by showcasing the value of graph analytics (also known as social networks) by using examples in anomaly detection applications, where one is interested in finding the most unusual data occurrences.
Graphs and graph analytics (a.k.a social networks or networks) can help in discovering different interactions, communications and relationships between one, or multiple data points. This enables implying more measures and context onto the data. A great deal of information can be discovered not only from data records themselves, but also from analyzing the relationship between the data points.
By using graph analytics, analysts can begin to utilize more out of what they already have by trying to understand the relationship between data. Most commonly, graphs or social networks are being used in fraud detection, money laundering investigations, recommendation engines, search engines, navigation and path planning and knowledge discovery.
What are graph analytics?
Graph (a.k.a social network) is an ordered (for directional graph) or unordered (for undirected graphs) pair of vertices and edges (a.k.a. nodes and links), where vertices can be represented as a circle, and edges as a line connecting those circles. The most common graph examples are family trees, tournament brackets, organizational charts, IOT charts, or Facebook and LinkedIn friends/colleague networks. Most commonly, graphs are interpreted as an adjacency matrix. This means that relationships can be processed by any conventional programming language and stored in any database.
Graph data structure represents each data point as an individual instance. In comparison to Entity Relation (ER), the data structure relationship between individual nodes can be unique. Graphs can be seen as a different paradigm to the traditional ER representation. Yet, it also comes with its own pros and cons.
We're hiring data professionals of different backgrounds! Click here.
Graph analytics methods
D. M. Hawkins once said: “An outlier is an observation which deviates so much from other observations as to arouse suspicions that it was generated by a different mechanism”. We can use graph analytics to identify and extract even more possible ‘deviations’, various types of measures and characteristics from the normal observations. Methods we can take to extract these measures from a graph-like structure is being researched by graph theory and the subfield of social sciences that focuses on social networks.
These methods can be split into two parts: traditional and graph methods. Graph methods can use statistical, machine learning, and any other knowledge discovery-based approach that utilizes graph structure and/or its characteristics. Graphs can be looked at from a fixed (static) or dynamic (for example describe change of interactions in time) standpoint. Not only are we able to extract proximity, statistics, angle, relation, isolation-based and other metrics for more traditionally structured data, but we are also able to explore graph-based metrics that describe individual vertices, edges, graphs or subgraphs. Although it might sound complicated for beginners, measuring different characteristics in graph structures are made easier by using researched algorithms that can be easily applied to your graph.
By understanding different measures, like connectivity, distance, centrality, similarity... etc., we can build a better understanding of our data. Arguably, the most popular graph algorithm, in my opinion, is PageRank, which determines the importance of each individual element in the graph by measuring the connectivity and the quality of connections of a particular vertex. This algorithm was the first Google Search algorithm. One might quickly find out how easy it is to develop your own search engine. Some readers might be familiar with Dijkstra’s shortest path algorithm or A* (A star – shortest path with heuristics) which is able to find the most optimal path between two points (very handy in navigation, path-planning or developing AI bots in your game). To be honest, there are a dozen more algorithms and approaches on how to solve and gather information for a particular problem. Try to find out what algorithm or approach would be better for your problem.
Don't miss Xomnia's latest business cases and blogs. Subscribe to our newsletter.
Analytical approaches to utilize graph structures
Community detection in graph networks
Graphs are often used to give more specific context to your inquiries. For example, you could apply community algorithms to narrow down a specific subgraph (subgroup of interest). Filtering is applied on the instance level. By giving context to the dataset, you might find local anomalies within each community. Community detection in graphs is a very powerful concept because many outliers could globally be considered ‘normal’. By identifying specific communities, one might discover how individual community members breach into other communities (and which ones).
Pattern matching
Just like with regular SQL reporting queries, in order to find predefined ‘anomalies’ or points of interest, one might want to apply specific filters (patterns) to a graph, also known as pattern matching. For example, applying an ego graph filter (vertex of interest with its neighboring vertices) with specific incoming or outgoing connection count OR [(point of interest)-(personal identifier)-(secondary point of interest)] like patterns where a researcher is trying to extract specific linking points. Pattern matching could help detect previously identified “anomalies”.
Edge and node, meta-path prediction
Not only we are able to model instance-level relationships, and set corresponding vertices, but we are also able to predict the probability of a link, node, or a pattern. It gives us the possibility to build a recommender, find potential conflicts of interest, or future collaborators, for example. Similar to more traditional data structures, the same knowledge discovery methods can be applied to graph-like data structure. Having graph data can provide us with more features to train our models. It’s most likely that advanced knowledge discovery methods are already utilizing instance level relationships between data points.
Graph Databases (neo4j)
Graph Databases (gdb) are databases that are optimized for graph structure data storage and processing. My experience and opinion mostly is biased by a particular database that I’ve been using – neo4j. Graph databases focus on storing instantiated data structure in a more efficient structure. The main difference between graph and relational db’s is that ERDB is modelled by (ER diagram) where each entity is a table and complex relationships (n:m; m:n) are described in additional tables (transaction tables). This provides a very effective and efficient way to store large amounts of data, yet it’s more difficult to describe unique relationships. It builds on another obstruction layer on top of the data. The only reason why we still accept obstructions is that we’ve been using ER approach for multiple decades, and it has become the “normal” approach.
On the other hand, Graph databases are storing relevant information generally in two tables – nodes and link tables which are partitioned by labels you can give to nodes. For this reason when you compare Graph Databases, ERDB is much harder to scale and distribute evenly because splitting graphs into multiple subgraphs has to take into consideration connectivity, path traversal, and amount of nodes in a partition.
Graph querying
Querying is yet another major difference which should be utilized if you’re working with graph data structure. You no longer need to join tables together in order to expand your analysis. You build your queries based on the graph meta-model (schema). Graph meta-model describes possible node-link-node connection options. Query returns all possible outcomes that match your desired pattern. Patterns are important features for graph data structures because data points are laid out on an individual node and relationship instance level.
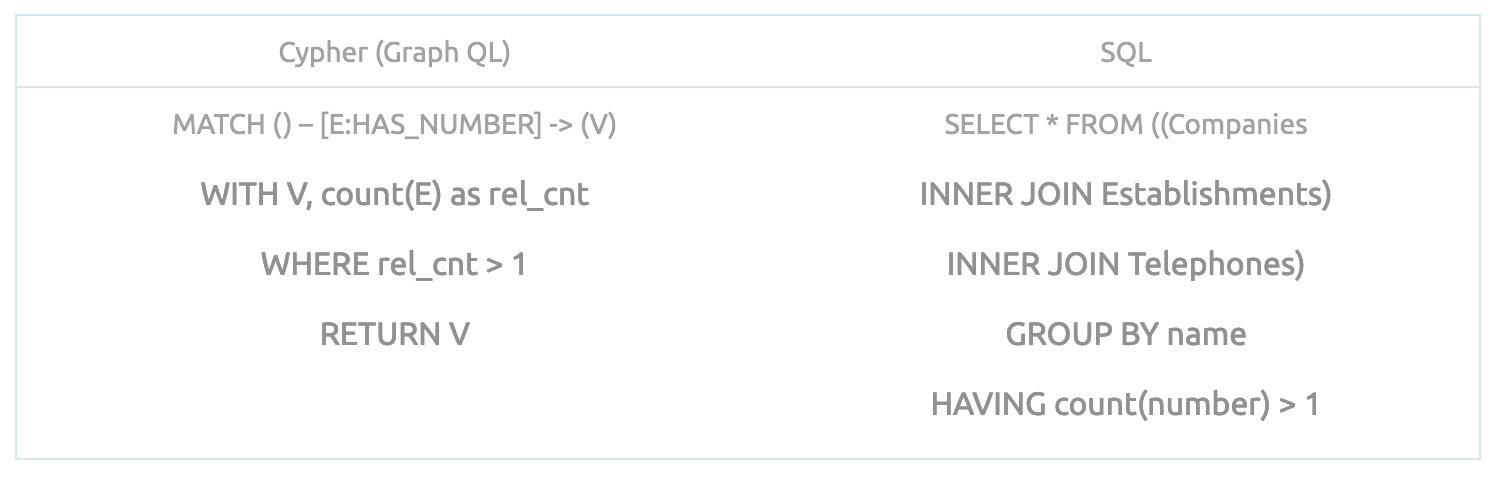
Understanding this difference will enable you to understand this very different data structure paradigm. For example, Cypher Query Language (CQL) is using the MATCH operator apply pattern you’re looking for. In the table below I demonstrate the difference between a regular SQL query and CQL.
Parsing through data records
Parsing through data points is very different as well. GDB are looping through data records in a particular table only once to find the first node in your match statement. Then the match statement is traversed through using a list of available outgoing relationships for that particular node. This process is roughly illustrated in the animation below. Traversal through available space using only available paths can significantly increase query performance because the engine is only looking at relevant and available neighboring nodes. By limiting maximal hops, you make sure that you’re trying to find only ‘close connections’.
Parsing through data points is very different as well. GDB are looping through data records in a particular table only once to find the first node in your match statement. Then the match statement is traversed through using a list of available outgoing relationships for that particular node. This process is roughly illustrated in the animation below. By limiting maximal hops, you make sure that you’re trying to find only ‘close connections’. A very amusing example of understanding connection and traversal between two points of interest is called Six Degrees of Kevin Bacon. This game states that any two people are six or fewer links apart from each other.
Join the leading data & AI consultancy in the Netherlands. Click here to view our vacancies
Conclusion
To sum up, graph analysis and its analytical tools are very beneficial for any data explorist and data scientist. You may become more effective in your work by being able to work with, or at least understand concepts and the different paradigm of graphs or social networks. In this blog, you have been introduced to graphs, looked at their purpose and use cases, seen the drawbacks and advantages of instantiated and highly relational data, and learnt a bit of the technical side of graph databases. I hope you will be more aware of your available toolkit while solving new and unknown challenges.